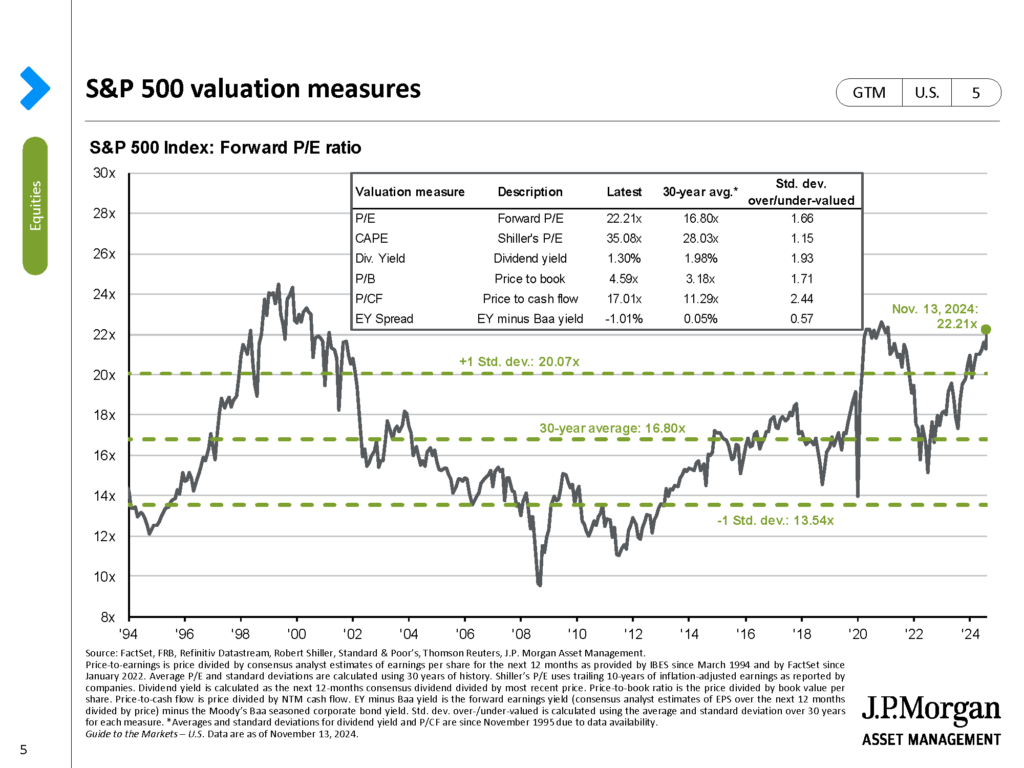
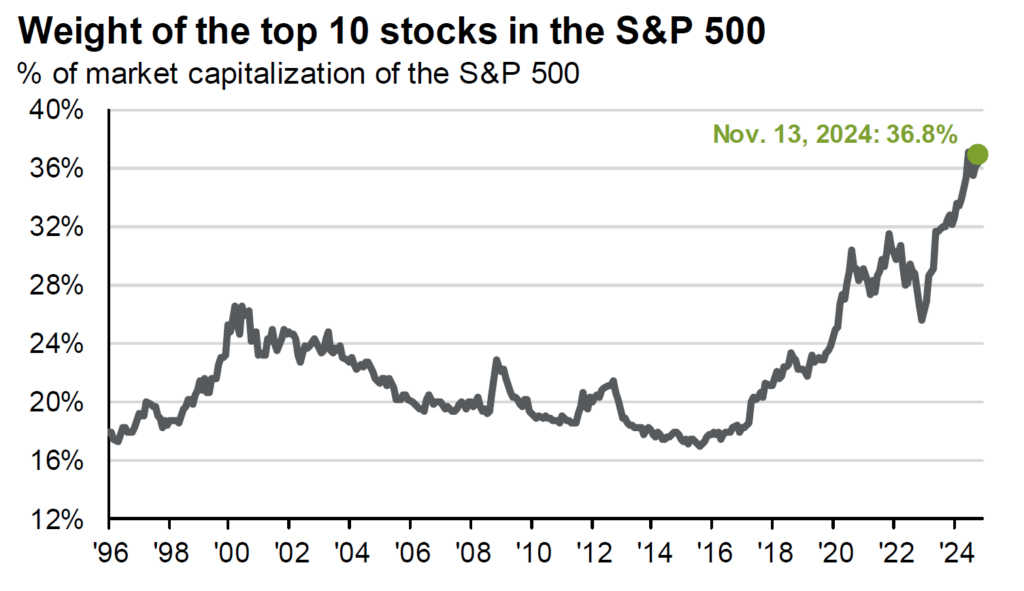
The S&P 500, a market-cap-weighted index of 500 large U.S. companies, continues to reach new highs, gaining over 22% through October 2024. With 47 record highs this year alone, analysts and investors are increasingly debating its valuation, especially as its forward 12-month price-to-earnings (P/E) ratio sits at 22.21, above the historical 5- and 10-year averages of 19.6 and 18.1, respectively.

The S&P 500 Index looks expensive compared with historical ranges, the elevated S&P 500 Index P/E not as concerning when you look at the fundamentals of the index. Many S&P 500 companies secured low, long-term borrowing rates before 2022’s rate hikes, leaving nearly half of their debt fixed through 2030. Additionally, cash reserves have grown since 2019, and debt relative to earnings is expected to decline over the next two years, indicating these companies have ample capacity to manage debt and continue growing even in shifting economic conditions.


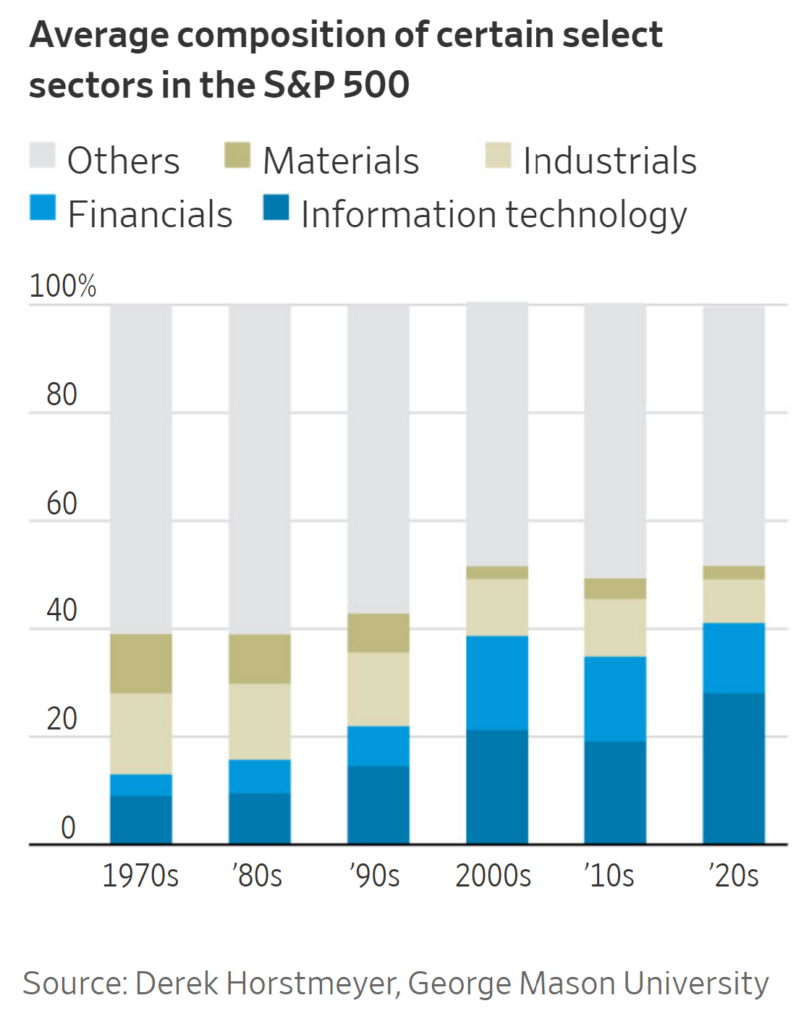
The performance difference between companies with domestic versus international revenue highlights this resilience: companies with over 50% U.S.-based revenue saw 12.6% year-over-year earnings growth in Q3 2024, while those with greater international exposure saw a decline. Sector composition also contributes to the P/E debate, with technology now nearly 30% of the index. An example of the shift comes from the Materials and Industrials sectors, two long-time sectors that used to make up over 25% of the S&P 500 Index, now comprise less than 11% combined and are two of the less growth-oriented sectors. Higher growth expectations in these tech-driven sectors support a higher P/E, aligning the index’s valuation with its evolving structure and underlying strength.

In conclusion, the S&P 500’s elevated P/E ratio is more than market enthusiasm—it reflects the strength of earnings, sound financial health, and an expanding U.S. economy. As the index leans toward high-growth sectors, a premium valuation is justified by both resilience and innovation, suggesting the market’s growth prospects remain solid. 2025 estimates confirm the expectations for earnings growth, with analysts predicting 15.2% earnings growth in calendar year 2025 versus 9.3% for calendar year 2024. The elevated S&P 500 Index P/E is less of a concerning metric when you start to look at the fundamentals of the index.


